Massachusetts HIP Retailers Data
MA HIP Retailers Dataset
HIP MAP Created in 2017 by David Webber at Mass Dept. of Agriculture
(MAPC and Alyssa Krogan converted the Map into Data Table form in 2020)
Original purpose and application.
The HIP Retailers Dataset, based on the Massgrown Map, is intended to list retailers within the Massachusetts area that provide customers with HIP (Healthy Incentive Program), SNAP (Supplemental Nutrition Assistance Program), and FMNP (Farmer’s Market Nutrition Program). Each of these programs offer either some discount or financial assistance for low-income consumers. It would be extremely helpful to those consumers to have the data on where to find retailers that offer such benefits. This data was organized by the Metropolitan Area Planning Council (MAPC) and the Massachusetts Department of Agriculture (MDAR). It is based on an internal database that MDAR uses to keep track of which areas are being served by and taking advantage of government assistance programs. Originally the Department of Transitional Assistance (DTA) used the Massgrown Map but since has their own version and database.
History, standards, and format
The Map was originally created in 2010 by MDAR and DTA, originally the Massgrown Map, but the Healthy Incentives Program (HIP) Map was created in 2017 by David Webber, who coordinates the Farmers Market Program as well as HIP. This was after the DTA created the program in the same year as such they had to update existing data constantly as more and more retailers started adopting the new program. It’s been updated at least 3 times in its whole existence with the HIP update being one of them. While the dataset by MAPC was pulled from June 2020 but this version of the Map was most likely updated within the past year, as David Webber surveys retailers offering HIP benefits each year. MDAR isn't the only one who collects the information, The Department of Transitional Assistance is the one who manages the Healthy Incentives Program but often most of the data, the locations of retailers, had been collected previously by MDAR. MAPC, specifically Alyssa Kogan, converted the map data into a data table which along with others was made into MAPC’s Massachusetts Food Systems Map. The HIP Retailers map is the most current form of the data.
Organizational context
Issues with standardization with pulling data from multiple datasets. Multiple sources means multiple formats and often that means not standardized “trying to clean the data and trying to make metadata and trying to figure out..how to get on a map.” Converting the MDAR and DTA Database to a Map then MAPC converting it back to a dataset for their MA Food Systems Map means reorganizing and reorienting which can increase the amount of time it takes. Alyssa Kogan also gave important context that often agencies work with multiple datasets over months long periods of time, dealing with other projects so even more reorienting is required.
Relevancy: The time it takes to acquire data means that often the data is outdated by the time it reaches the public. Oftentimes teams are working on multiple projects and only update every three to six months, at that point it’s hard to remember some of the specifics. As mentioned the Map may be current but if one uses the dataset looking for information like phone numbers or closing times, the 2020 dataset is pre pandemic. The COVID-19 Pandemic specifically is a situation where data is constantly changing and needs to be updated regularly. The updates to the map can also come from retailers themselves and retailers are not held to the same standards MDAR and DTA are as government organizations.
Amount of people working on it: Only a single person in the MDAR actually works with this data, one in house programer. There may be others who update the system but the original HIP update was put together by one developer. This plays into standardization issues where every one of the updates has to work around the design of that one programmer. The HIP update itself was built on work from other agencies which so the chances of inconsistency increases.
Automatic Updates: the automated update system based on an internal database, David Webber explained that when the database is updated, the online map automatically updates with the changes. Automated updates converting table data to map data can lead to issues if not checked internally.
Workflow.
The MDAR database of retailers was being updated constantly after the release of the program in 2017. As mentioned the foundation was the Massgrown Map and according to David Webber, “was consolidated from staff’s database/lists of farms from 11+ sources.” For the HIP update, It took around 12 months with David as the only MDAR developer, coordinating with the retailers and the DTA who run the program.
The map was developed using open source technologies including ASP.NET, C#, Javascript, Google Maps API, and SQL Server.
Updating the Map is a continuing effort, MDAR’s database administrator João Tavares told me the list is updated daily. Webber clarified that the update process is done by several users as needed, “when there are changes in hours, locations, etc.” There’s also the database so when a completely new entry is added, the map is connected with an internal database that updates automatically.
As it is primarily a collection effort, with retailers willingly giving their information to MDAR, there was no purchasing of data for the map, it was used by MAPC along with purchased data for their Massachusetts Food System Map. There was a whole purchasing team at MAPC that coordinated that separately from the data creators. The MAPC also has a different audience of policymakers and practitioners according to Alyssa Kogan, as opposed to the Map which is intended for consumers and those on SNAP benefits.
Exploratory Visualization/s of the Data
1 - 3 data visualizations that help characterize some basic patterns in the data. For example, it would be helpful in a user guide to show where there is a lot of missing data.
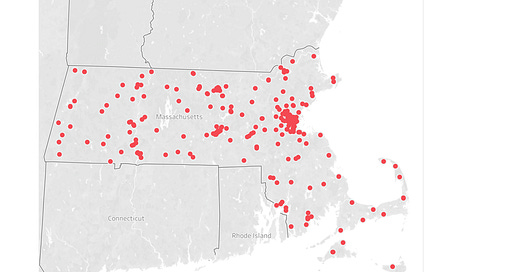
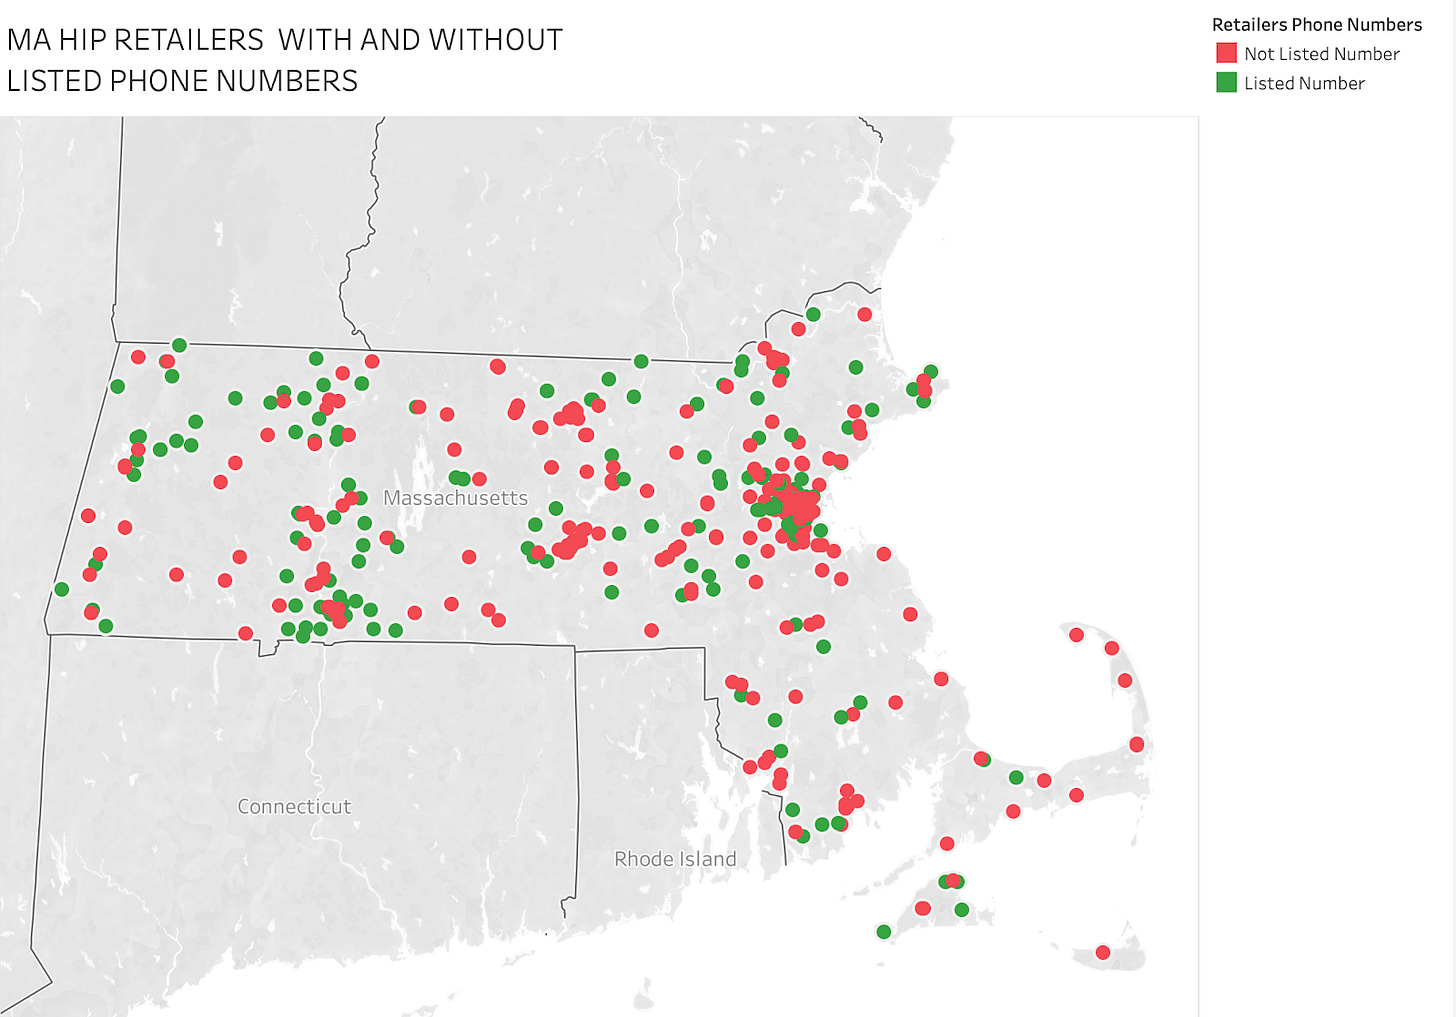
Figure 1- Side by Side Comparison of MA HIP RETAILERS MAP Locations With and Without Listed Phone Numbers
Green is Locations with Phone Numbers
Red is Locations without Phone Numbers
Figure 2- Layered view of of MA HIP RETAILERS MAP Locations With and Without Listed Phone Numbers
Some points on the data don’t list a phone number but do list a website which often does have a phone number. Around 240 of the places listed do not have phone numbers whereas 184 do have phone numbers, the majority are without. While there is the explanation a decent portion of farmers markets don’t have a central phone number, there is still no way other than physically going to the store to confirm they still have the benefits listed. For a dataset published a little after the COVID-19 Lockdown that would be incredibly important information for getting food delivered, or for someone with a handicap. For some of these locations the website link confirms these places do have a phone number so unsure why it is not listed. (See visualizations above) Retrieved from the MA HIP Retailers Dataset, Alyssa Kogan, 2020
Things to know about the data, including limitations
Are there any other limitations or details related to this dataset that limit or guide its use and interpretation?
80 of the locations listed in the are CSA pickup sites (Community Supported Agriculture sites) These are direct farm to hand sellers often made to prioritize their specific community’s needs. As such they’re not meant for too many people outside the community to use and usually seasonal
Other Stories, Reports and Outputs from this data
How have others made use of this data? Provide hyperlinks to applications, stories, reports or other ways we can see the data in action.
Sites/articles that use this data:
Supplementary Information
The DTA actually now uses their own Map rather than the MassGrown/HIP Retailers Map
Authors of this Data User Guide
Petra Wolf and Steven Zheng
Source Log
Special Thanks to Alyssa Kogan, David Webber, and João Tavares for their contributions to this document.


